Matthew Sexton, LCSW, NATC — licensed clinical social worker in private practice. Sources current as of July 25, 2026; association benchmarking figures below describe all-specialty medical groups rather than solo behavioral health practices.
In a 2005 study, 40 therapists were asked after every session to predict one thing: would this client finish treatment worse off than when they started? Across 550 clients over three weeks, 40 clients actually deteriorated. The therapists predicted deterioration for 3. The 20 experienced licensed clinicians in that sample, averaging ten years of post-doctoral practice, correctly identified none of them, and the one accurate call came from a trainee. Statistical methods applied to the same clients' questionnaire scores flagged 36 of the 40 (Hannan et al., 2005, as described in Lambert, 2015). Those clinicians were not careless. They were uninstrumented. That is a different problem with a different fix.
Here is the shape of the argument before the detail:
- Clinicians are confident readers of their own caseloads, and confidence is a poor proxy for accuracy.
- Feedback helps most with the at-risk clients, and those are the ones a human eye loses at caseload scale.
- Almost nobody does this, and the reason is friction.
- One in five clients drops out of therapy, which is simultaneously a clinical failure and a hole in your schedule.
- The financial benchmarks circulating in therapist Facebook groups mostly do not exist. Your own baseline does.
What those 40 therapists actually missed
It is easy to read the Hannan study as a shot at clinicians. It reads more like a defense of them.
— Matthew Sexton, LCSW, NATC
Every therapist in that sample knew they were being asked to predict deterioration. They knew the researchers were watching. They still called 3 out of 40, and the decade-of-experience group went 0 for 40. Separately, the therapists rated nearly 40% of their clients as improved while those same clients were reporting more symptoms on the OQ-45 than they had at intake (Lambert, 2015).
Think about what the job actually asks. You see a client for four sessions a month. The other 26 days, that person's week happens without you, and the only data you get about it arrives filtered through what they choose to tell you in the first ten minutes of the next session, after a commute, in a chair, to someone whose approval they want. Slow decline does not announce itself. It reads as a plateau, and a plateau reads as a phase.
A model reading a questionnaire has none of your clinical range and none of your relationship. It has one advantage: it never gets used to a number. A score that slides four points a month for five months is a straight line to a computer and an unremarkable series of okay-ish sessions to a person.
What outcomes tracking in a private practice actually buys, stated honestly
Two numbers matter here, and quoting only the first one would be selling you something.
The headline result comes from a combined meta-analytic and mega-analytic reanalysis of six studies covering 6,151 clients. When therapists received routine progress feedback on clients whose scores triggered a not-on-track signal, deterioration fell from 20.1% under treatment as usual to 5.5% in the feedback condition that included Clinical Support Tools. The share of those at-risk clients who achieved a positive outcome more than doubled, from 22.3% to 55.5% (Shimokawa, Lambert & Smart, 2010, as reported in Lambert, 2015).
Now the counterweight. A multilevel meta-analysis of 58 studies, 110 effect sizes and 21,699 patients found that progress feedback produced a small significant effect on symptom reduction, d = 0.15, 95% CI [0.10, 0.20], against control. For not-on-track cases it was d = 0.17, 95% CI [0.11, 0.22]. Feedback also had a small favorable effect on dropout, OR = 1.19, 95% CI [1.03, 1.38] (de Jong et al., 2021).
Side by side, with the caveat in the same frame as the headline:
| What was measured | Treatment as usual | With progress feedback | Population | Source |
|---|---|---|---|---|
| Deterioration | 20.1% | 5.5% | At-risk clients only (N = 6,151) | Shimokawa, Lambert & Smart, 2010, as reported in Lambert, 2015 |
| Positive outcome | 22.3% | 55.5% | At-risk clients only (N = 6,151) | Shimokawa, Lambert & Smart, 2010, as reported in Lambert, 2015 |
| Symptom reduction | control group (reference) | d = 0.15, 95% CI [0.10, 0.20] | All clients (58 studies, 21,699 patients) | de Jong et al., 2021 |
| Symptom reduction | control group (reference) | d = 0.17, 95% CI [0.11, 0.22] | Not-on-track cases | de Jong et al., 2021 |
| Dropout | control group (reference) | OR = 1.19, 95% CI [1.03, 1.38] | All clients (58 studies, 21,699 patients) | de Jong et al., 2021 |
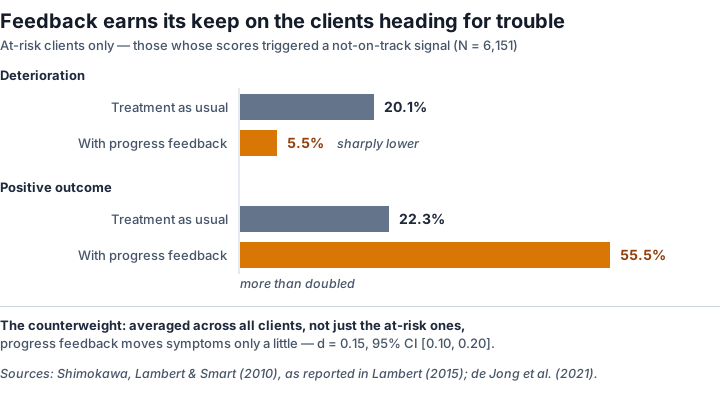
Both halves of the same evidence base, in one frame. Sources: Shimokawa, Lambert & Smart (2010), N = 6,151, as reported in Lambert (2015); de Jong et al. (2021), 58 studies, 21,699 patients.
Both of those are true, and the tension between them is the actual finding. Averaged across every client who walks through your door, feedback moves symptoms a little. Concentrated on the clients heading for trouble, it moves the outcome a lot. So instrumentation earns its keep on the four or five specific people this quarter whose trajectory has turned, and on catching them early enough to do something clinical about it.
That is a search problem. Search problems are what software is for.
Almost nobody is doing it, and they know they should be
A national survey of 504 clinicians found that only 13.9% used standardized progress measures at least monthly, and 61.5% never used them (Jensen-Doss et al., 2018). The same survey found those clinicians held generally positive attitudes toward monitoring and feedback in principle. They believe in it. They do not do it.
The broader estimate is no better. APA's own case for a measurement-based care practice guideline states that uptake remains under 20% of mental and behavioral health providers, even though the same authors describe the research base behind it as well established (Boswell et al., 2022).
That same paper names a real contributor to the mess: measurement-based care, routine outcome monitoring, and feedback-informed treatment get used near-interchangeably in the literature, and the absence of a shared term is itself an adoption barrier. When the field cannot agree what the thing is called, a clinician searching for how to start finds three vocabularies and no on-ramp.
The gap between belief and behavior here is friction, not character. Scoring by hand, entering results somewhere, remembering to look at them before the next session, noticing a five-month slide across thirty charts. Every one of those steps is a place where a solo practice loses the thread on a Thursday.
The number that connects the clinical half to the money half
Across 669 studies representing 83,834 clients, the weighted premature-discontinuation rate in adult psychotherapy was 19.7%, 95% CI [18.7%, 20.7%] (Swift & Greenberg, 2012). About one client in five leaves before the work is done.
Dropout in that meta-analysis was moderated by client diagnosis and age, by provider experience level, and by treatment setting. It was not moderated by therapy orientation, by individual versus group format, or by most client demographics. Trainee-seen clients and clients with personality or eating disorder diagnoses left at higher rates. (The older 47% figure you may have seen quoted comes from a 1993 review that this meta-analysis explicitly supersedes. Retire it.)
One in five means something specific in a private practice. A treatment that did not finish and a recurring slot that empties without notice are the same event, described by two different departments. The de Jong meta-analysis found feedback reduces dropout. So watching your outcomes and running a solvent practice turn out to be one activity, which is worth remembering the next time retention gets filed under marketing. (We went deeper on the clinical side of that in private practice client retention, and on the between-session gap in keeping clients engaged between sessions.)
The business half, and the benchmark that does not exist
Here is where honesty costs something, so let me be direct about it.
Researching this piece, we went looking for the numbers therapists get told to hit. Days in accounts receivable under 35. A net collection rate of 95 to 99%. Above 50 days means a structural problem. Those figures circulate constantly in practice-building content, usually attributed to MGMA or to an unnamed industry standard.
We could not verify a single one of them. Every trail led to a medical-billing vendor's blog quoting a round number with no survey, no sample size, and no methodology behind it. No MGMA-published absolute days-in-A/R count turned up at all. The one MGMA article we did verify expresses the measure only as a percentage relative to a median, never as a day count.
So there is no verified solo-therapy collection-rate benchmark in this post, because as far as we can tell there is not one in the world. If a number cannot be traced to a survey with a disclosed method, it is a marketing artifact wearing a lab coat, and repeating it would be the same failure of instrumentation this whole post is about.
What does exist is association benchmarking on all-specialty medical groups, which is a different animal from a solo behavioral health practice. Treat it as direction of travel, never as your target.
The strongest of it is a collection story. MGMA benchmarking data shows time-of-service copay collection fell from about 90% pre-pandemic in 2019 to 56% in 2022. Over the same period, time-of-service collection of patient-due balances rose from about 15% to 39% (MGMA Stat, October 22, 2025). In a poll of 247 medical group leaders fielded October 21, 2025, 66% said patient balance collections were about the same (40%) or better (26%) than 2024, while 29% said they had worsened. The groups reporting improvement most often credited tightening front-end process and emphasizing collection at time of service with clearer cost estimates.
That copay number is the most useful financial fact here. Money you do not collect in the room gets an order of magnitude harder to collect later, and the industry as a whole got much worse at collecting in the room. For a solo practice, card-on-file at the time of service is the biggest lever you personally control, and unlike your reimbursement rate, nobody has to approve it.
On receivables, MGMA classifies practices as Better Performers using below-median A/R over 120 days, below-median days in A/R, and above-median adjusted collection percentage. Among multispecialty groups, Better Performers carried only 8.1% of accounts receivable in the over-120-days bucket, had days in A/R 25% below the median, and 70% less bad debt. Their medical revenue after operating cost ran $402,620 per FTE physician against $260,750 across all groups (MGMA, December 14, 2021). Two caveats to hold onto: that population is multispecialty medical groups with primary and specialty care, and the underlying data year is 2020, the most operationally distorted year on record. Read it as a direction. The practices that win keep almost nothing sitting past 120 days.
Attendance: what the peer-reviewed data actually says
The no-show numbers circulating in therapist content tend to be vendor-sourced too. Here is the defensible one.
A pragmatic randomized trial covering 9,420 patients and 38,945 mental health appointments between October 15, 2020 and October 14, 2021 found missed-appointment rates of 18.0% to 21.9% across study arms (Teo et al., 2023). Roughly one appointment in five. That is a VA medical center and its satellite clinics, a long way from a tri-state commercial and cash-pay caseload. It sets an order of magnitude. Your own rate is your benchmark.
Behavioral-nudge reminder letters did not significantly improve attendance in the mental health clinics (OR = 1.20, 95% CI 0.90 to 1.60, p = 0.21). Sending more reminders is not the intervention. If you are losing a fifth of your slots, the fix is structural, which usually means a no-show and late-cancel policy you actually enforce plus a real look at who is drifting.
On the trend, an MGMA Stat poll of 265 medical practice leaders fielded August 12, 2025 found 73% reported no-show rates had stayed the same (60%) or decreased (13%) in 2025 relative to 2024, while 27% said they increased (MGMA Stat, August 14, 2025). Self-reported direction from all-specialty groups, so read it as weather.
Practice analytics for therapists: the five numbers a solo practice should be able to see
No benchmark table, because the honest version does not have one. Formulas, a habit, and your own baseline.
1. At-risk clients this month. Pick one validated measure, administer it on a fixed schedule, and define a threshold that constitutes an alarm. The count you want is a list of names whose trajectory turned, not a caseload average. Review it weekly.
2. Dropout rate. Clients who stopped without a planned ending, divided by clients seen in the period. Compute it quarterly. The published anchor is 19.7% across the field, so you at least know roughly where the middle of the road sits.
3. Attendance rate. Kept appointments divided by scheduled appointments. Track late cancels separately from no-shows, because they are different behaviors with different fixes. The clinical half of that split is worked through in how to reduce therapy no-shows clinically.
4. Time-of-service collection rate. Amount collected at the visit divided by patient responsibility due at that visit. This is the one with real published evidence behind it, and it is entirely within your control.
5. Aging of receivables. The share of your outstanding balance sitting past 120 days. Ignore the internet's day-count targets. Watch whether your own number is rising or falling quarter over quarter. That tells you more than any borrowed median.
None of those five requires a data analyst. All five require that something is capturing them while you work, because a metric you have to assemble by hand on a Sunday is a metric you will compute twice and then abandon.
What to actually do in the next month
Start with one thing, and not with a dashboard.
Choose a single progress measure and put it on a fixed cadence, every session or every other session. Write down, in advance, the change that will count as an alarm. A threshold you set before you are emotionally invested in a client is worth more than one you negotiate with yourself afterward. Then set a standing fifteen minutes each week to look at only the alarms, and treat that review as clinical time. It is the highest-yield quarter hour in the research cited above.
On the money side, do one thing too: put a card on file and collect at the time of service. Given that copay collection across medical groups fell from roughly 90% to 56%, this is the lever with the clearest evidence behind it and the shortest path to your bank account.
The software job here is unglamorous. Something should be watching every score, every gap between sessions, every unpaid balance, and surfacing the three names that need attention this week. That is the part of practice analytics worth automating, and it is the standard the outcome and practice-health work in VibeCheck.luxury is being built against: currently in beta, unlimited clients. No software makes the clinical call for you. It can make sure the call is in front of you while there is still time to make it.
The VibeCheck.luxury EMR is currently in beta. Pricing is not publicly listed; email [email protected] for more information.
FAQ
What is routine outcome monitoring in private practice?
It means administering a brief validated measure on a fixed schedule, tracking each client's scores across sessions, and acting on a defined alarm threshold when a trajectory turns the wrong way. In the literature it also travels under measurement-based care and feedback-informed treatment, and the lack of one shared term is itself documented as an adoption barrier.
Do therapists really miss client deterioration?
The best-known study on this asked 40 therapists to predict deterioration after every session across 550 clients. Forty clients deteriorated; therapists predicted 3, and the experienced clinicians in the sample correctly identified none. Statistical methods applied to the same questionnaire data flagged 36 of the 40. The therapists also rated nearly 40% of clients as improved while those clients reported worse scores than at intake.
How many therapists actually use outcome measures?
In a national survey of 504 clinicians, 13.9% reported using standardized progress measures at least monthly and 61.5% never used them, despite holding generally positive attitudes toward the practice. APA's measurement-based care guideline paper puts overall uptake at under 20% of mental and behavioral health providers.
Does tracking outcomes reduce dropout?
Yes, modestly and measurably. A multilevel meta-analysis of 58 studies and 21,699 patients found progress feedback had a small favorable effect on dropout, OR = 1.19, 95% CI [1.03, 1.38], alongside a small effect on symptom reduction, d = 0.15. The larger effects appear among at-risk cases rather than across a whole caseload.
What is a good collection rate for a solo therapy practice?
There is no verifiable published benchmark. The figures commonly quoted, including a 95 to 99% net collection rate and roughly 35 days in accounts receivable, trace back to billing-vendor blog posts with no disclosed methodology rather than to any association survey. Track your own collection rate and receivables aging over time, and compare your practice against its own prior quarters.
What should a solo clinician measure first?
One progress measure on a fixed cadence, with a written alarm threshold and a standing weekly review of only the alarms. On the business side, time-of-service collection, because MGMA benchmarking shows copay collection across medical groups fell from about 90% in 2019 to 56% in 2022, and it is the lever a solo practice fully controls.